Projects
A showcase of practical implementations and creative problem solving.
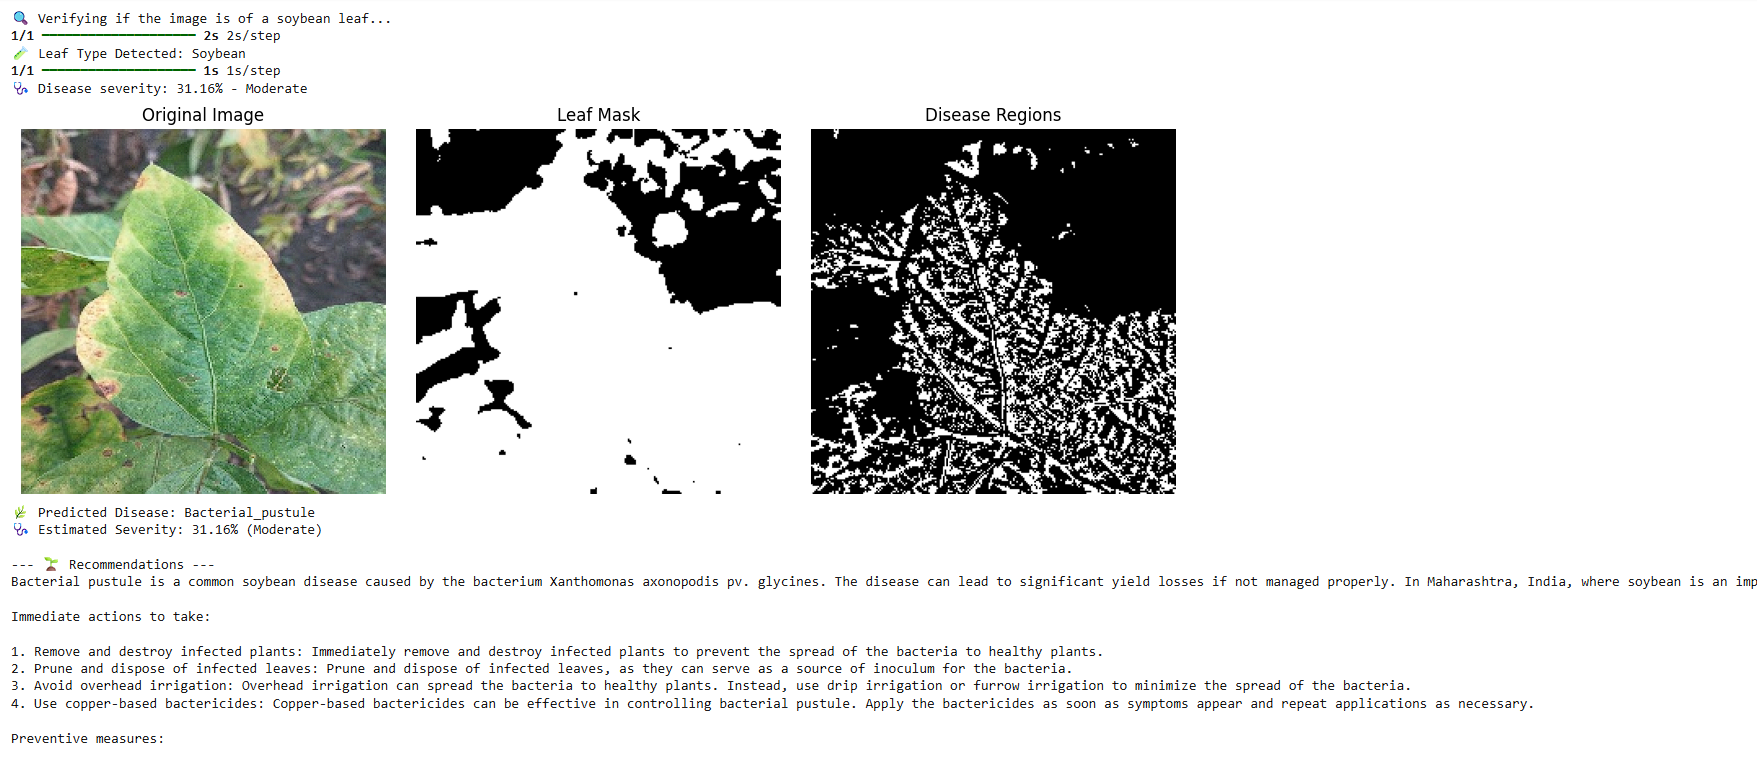
Soybean Leaf Disease Detection and Recommendation
 GitHub Link
A machine learning-based application designed to identify diseases in soybean leaves from images using deep learning models. It ensures precision by filtering out non-soybean leaves, assesses disease severity, and provides tailored recommendations for treatment. The system integrates a CNN classifier and Random Forest model to improve accuracy and leverages APIs for scalable prediction delivery.
Key Features
- Disease Detection: Identifies soybean leaf diseases using image input.
- Non-Soybean Filter: Ignores irrelevant or incorrect leaf types.
- Severity Analysis: Determines the level of infection severity.
- Treatment Guidance: Suggests actionable recommendations based on disease type.
- Model Integration: Combines CNN and Random Forest for better accuracy.
Tech Stack
- Python
- Machine Learning
- API
- CNN
- Random Forest
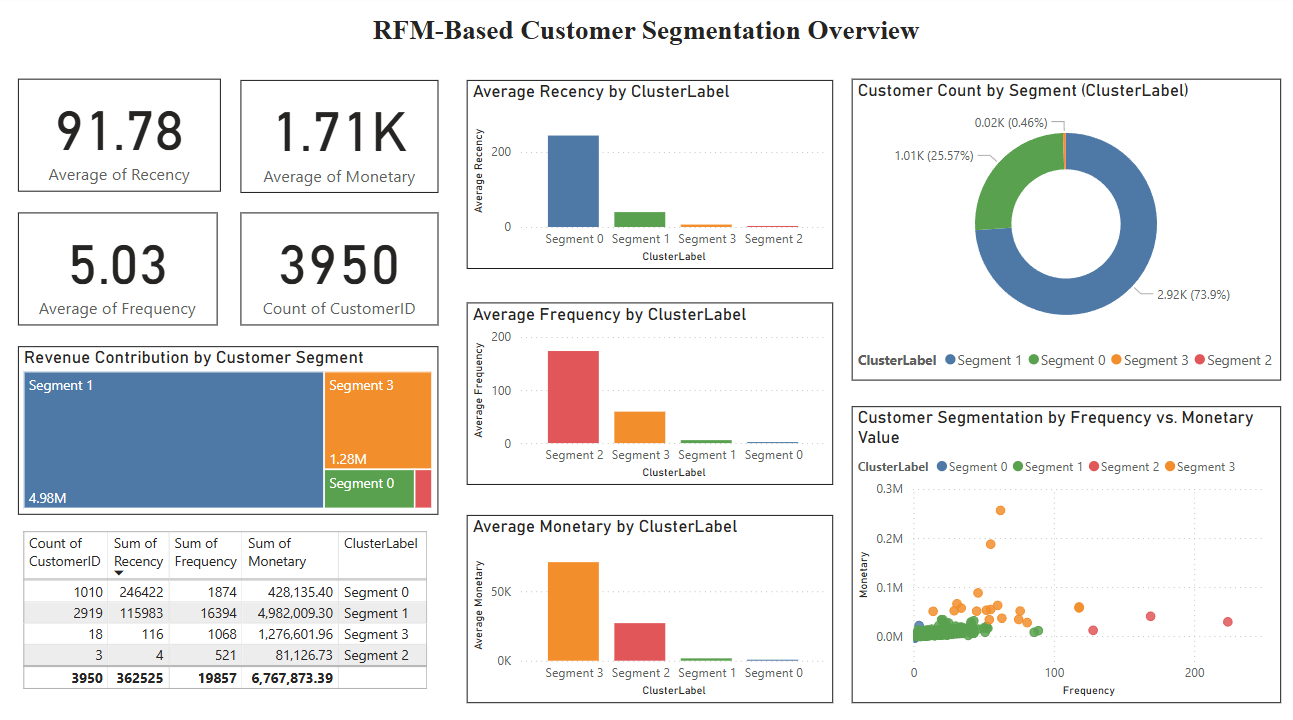
Customer Segmentation & Analytics Dashboard
 GitHub Link
A data science project that segments customers using the RFM (Recency, Frequency, Monetary) model and K-Means clustering. The segmented insights are visualized using a rich Power BI dashboard. The project leverages exploratory analysis, feature engineering, and unsupervised learning to group customers and support marketing strategies.
Key Features
- Data Cleaning: Preprocessing for handling missing values and duplicates.
- RFM Analysis: Calculation of Recency, Frequency, and Monetary values.
- Elbow Method: Optimal cluster selection using inertia visualization.
- K-Means Clustering: Customer grouping into meaningful segments.
- Power BI Dashboard: Interactive visualizations including KPI cards, charts, and a treemap.
Tech Stack
- Python
- Pandas & Matplotlib
- Scikit-learn
- Power BI
- Jupyter Notebook
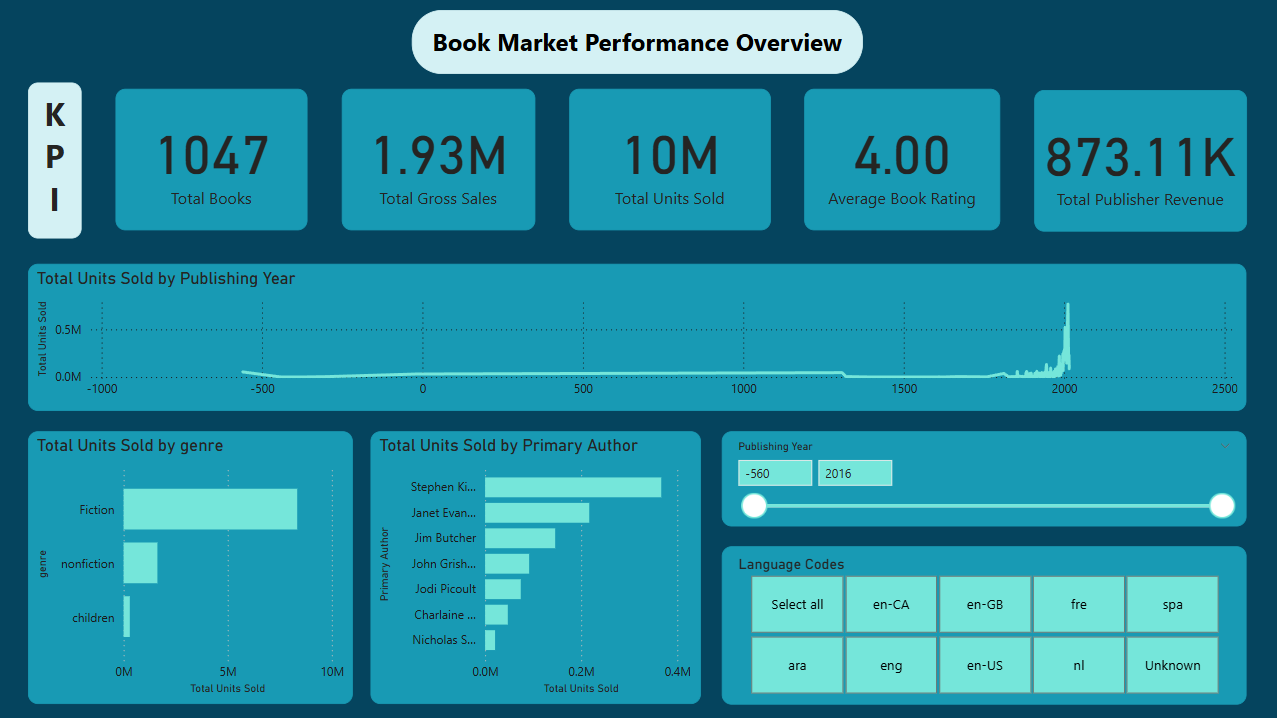
Book Market Insights Dashboard
 GitHub Link
A comprehensive data analysis project culminating in an interactive Power BI dashboard, offering deep insights into book sales, ratings, and market trends. The project covers the entire data pipeline from raw data cleaning and exploratory data analysis (EDA) in Python to the creation of a dynamic and actionable dashboard. It identifies top-performing books, authors, and genres, uncovers key market patterns, and provides data-driven recommendations for businesses in the publishing industry.
Key Features
- End-to-End Data Pipeline: From raw data to interactive dashboard.
- Advanced Data Cleaning: Handles missing values, standardizes text, and ensures data quality.
- In-depth EDA: Uncovers trends, distributions, and relationships using Python (Pandas, Matplotlib, Seaborn).
- Feature Engineering: Creates new valuable metrics like 'Primary Author', 'Rating Category', 'Total Revenue', and 'Publisher Profit'.
- Interactive Power BI Dashboard: Features multi-page design with KPIs, trend analysis, top author/genre breakdowns, and drill-down capabilities.
- Actionable Insights: Identifies "hidden gems" (high-rated, low-selling books) and provides concrete business recommendations.
Tech Stack
- Python
- Pandas
- Matplotlib & Seaborn
- Power BI Desktop
- Jupyter Notebook
- VS Code
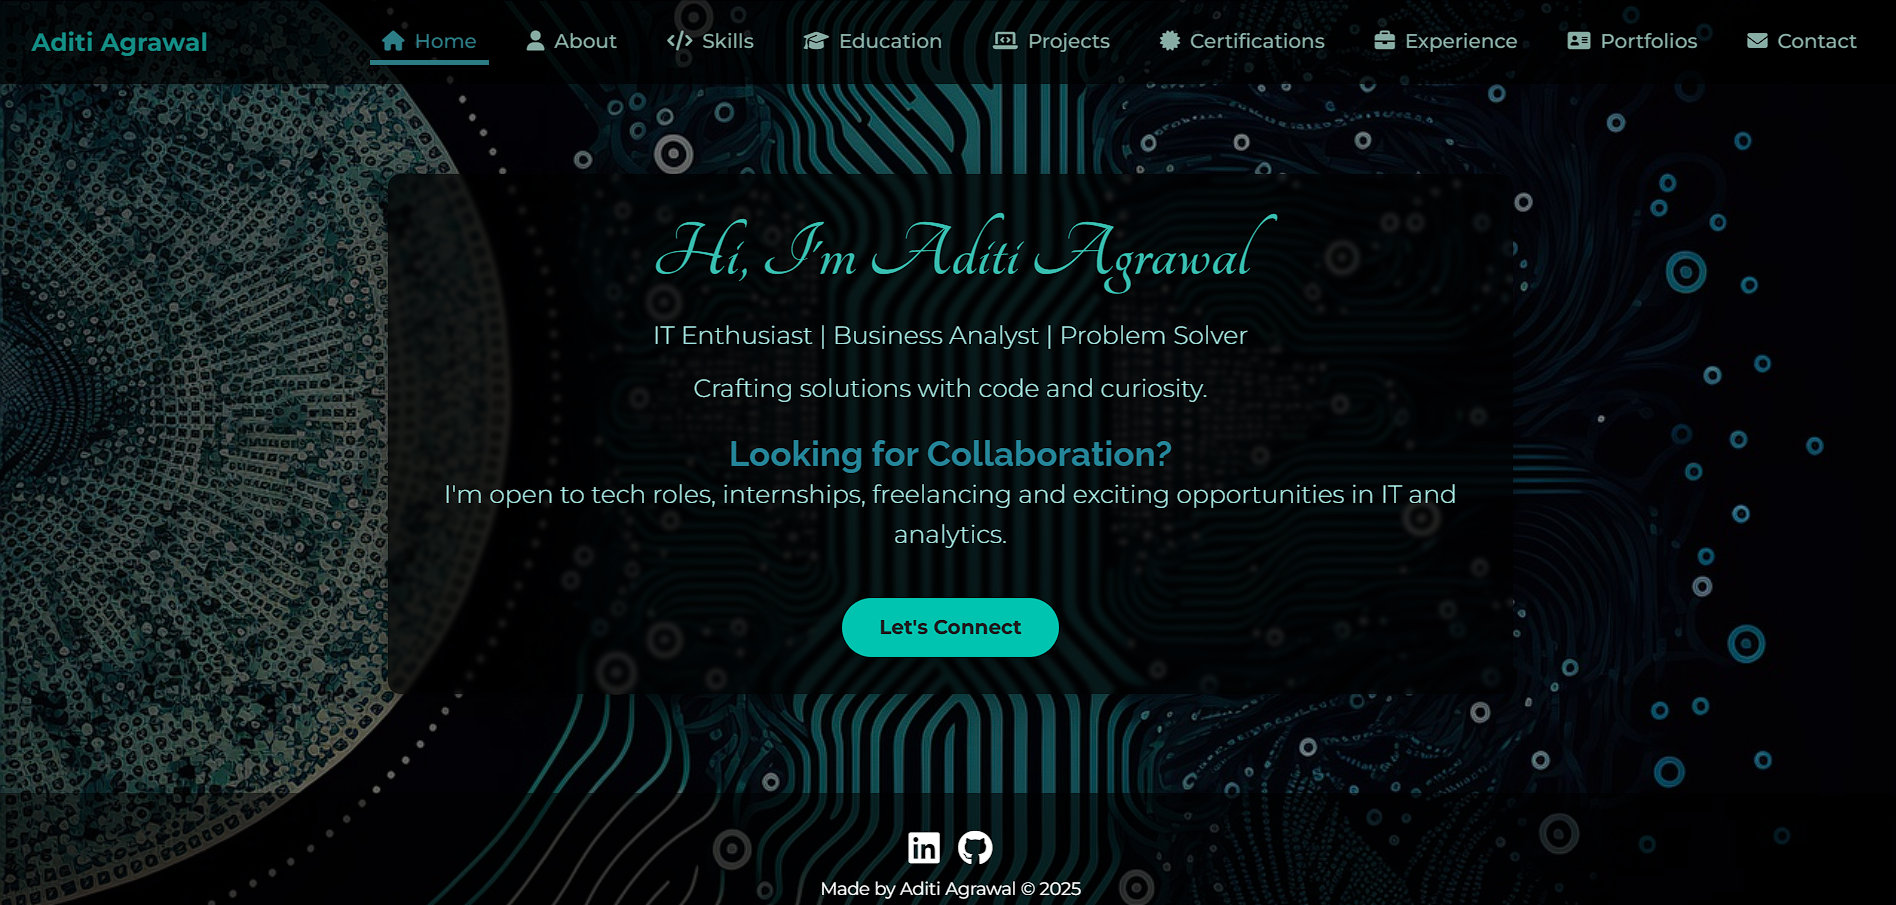
Portfolio Website
 GitHub Link
A fully responsive and interactive personal portfolio website built using modern web technologies. The platform showcases professional experience, projects, and skills with smooth animations and a clean UI.
Key Features
- Responsive Design: Optimized for all devices and screen sizes.
- Animated UI: Smooth transitions and micro-interactions enhance user experience.
Tech Stack
- HTML5
- CSS3
- JavaScript
Shopping Dashboard
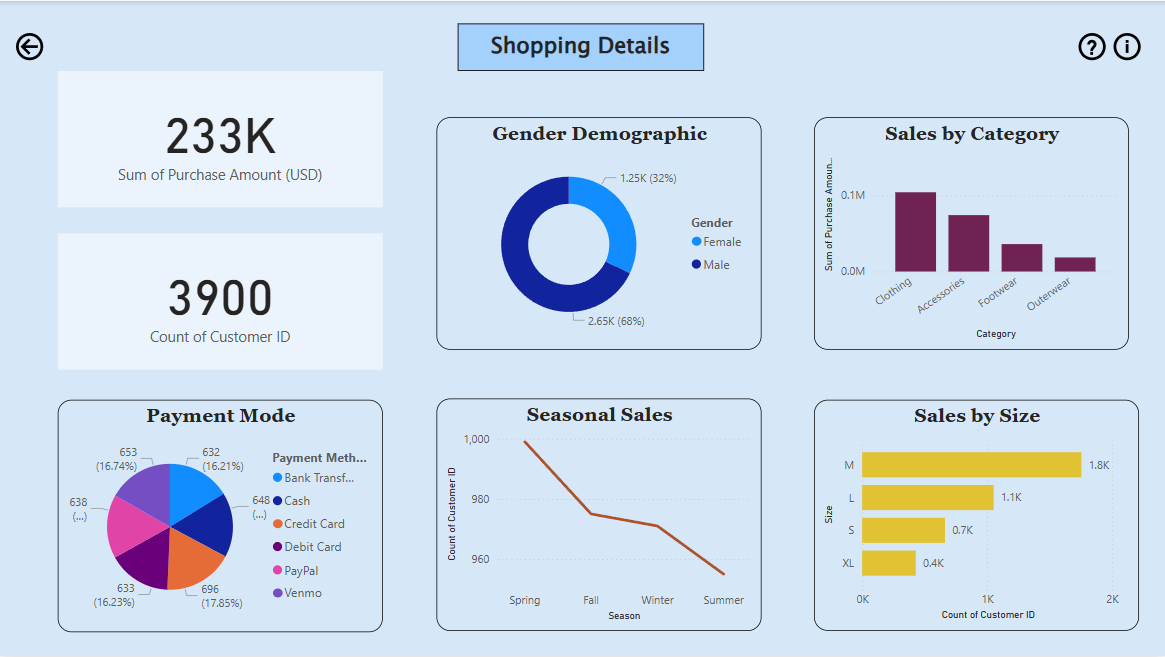
A comprehensive Power BI dashboard designed to analyze retail shopping data. It provides actionable insights into customer demographics, purchase behavior, and seasonal trends. Key metrics such as total purchase amount, customer count, and preferred payment methods are visualized alongside categorical breakdowns of sales by product type and size. The dashboard supports interactive exploration for strategic business decision-making.
Key Features
- Dynamic Filters: Explore data interactively with slicers.
- Visual Breakdown: Charts for category, size, and season-based sales.
- Customer Insights: Gender demographics and count analysis.
- Purchase Trends: Payment mode stats and seasonal behavior.
- Summary Metrics: Total purchases and customer count KPIs.
Tech Stack
- Power Bi
- Excel
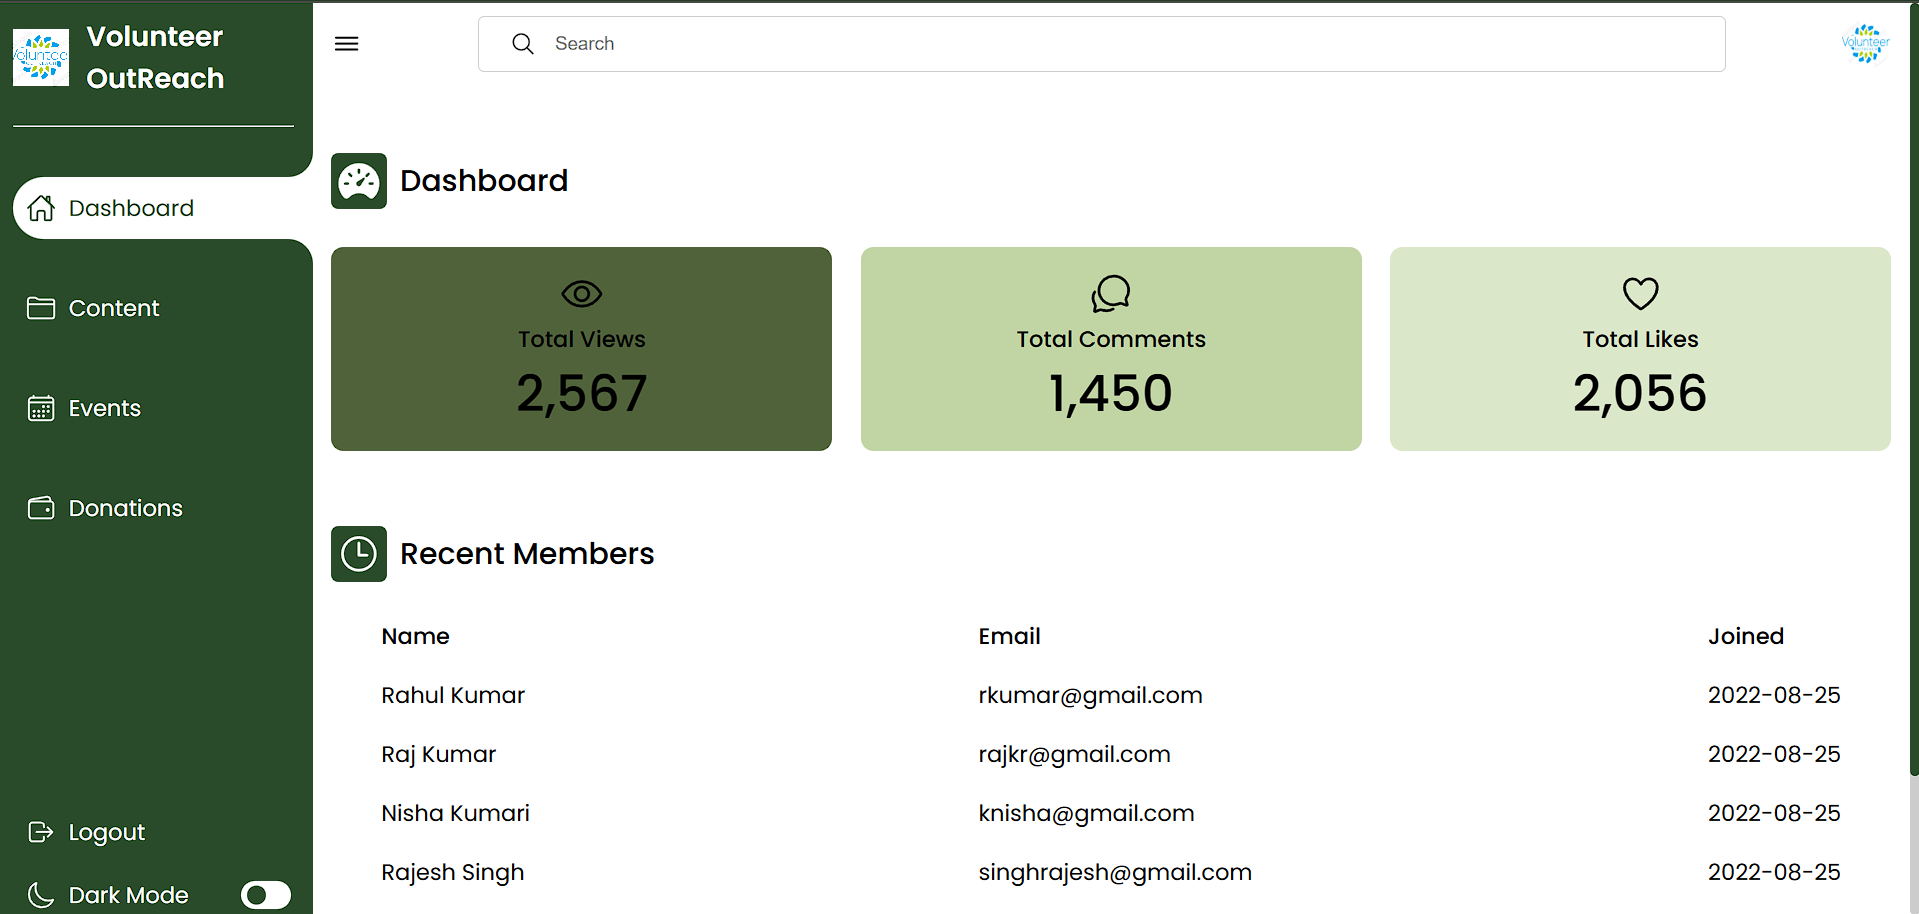
Volunteer Dashboard
 GitHub Link
A comprehensive Power BI dashboard designed to analyze retail shopping data. It provides actionable insights into customer demographics, purchase behavior, and seasonal trends. Key metrics such as total purchase amount, customer count, and preferred payment methods are visualized alongside categorical breakdowns of sales by product type and size. The dashboard supports interactive exploration for strategic business decision-making.
Key Features
- Dark/Light Mode: Toggle switch for personalized viewing preferences.
- Dynamic Filters: Explore data interactively with slicers.
- Visual Breakdown: Charts for category, size, and season-based sales.
- Customer Insights: Gender demographics and count analysis.
- Summary Metrics: Total purchases and customer count KPIs.
Tech Stack
- HTML
- CSS
- JavaScript